Sunday

Trading Trends In Forex

Following trends is something that every trader ought to know. This means that the trader ought to know exactly what the market is leaning towards and what goods or services to offer at what point. In the forex forex market, the idea behind following the trend is more or less similar. The idea behind trending is that you anticipate the direction that the market is bound to take and look to make money in the event of such a movement. In essence, by choosing the correct trends, the trader can get into the trade early enough and ride the wave until it is almost through. By trend trading, a trader also protects himself or herself from staying in a trade too long and losing out of the benefits that had come with the trade initially. Through trend trading, the trader can determine the peak of a wave and pull out before the downward trend begins. If the trader is relying on the downward trend, then he or she can look out for the best deal and quit while the profits are maximum. The trick in trend trading is to know just when to get in and at what point to quit the market.

up trend


In general, prices in the forex market move in three major ways; upwards, downwards or sideways. In general, during a downward it is common to find that the peaks often go much lower than the points that are right before them. After such a trend, it is quite typical to find that one of the peaks rises just above the previous one; that should be your point of entry as it represents a potential swing back to an upward trend. Once you buy in, you need to look out for the peak during the upward trend since you do not want to stay in that position for too long. Once you see the ever increasing peaks have begun reducing, that should be your cue to quit the market. For instance, if the price of a currency is just picking up from a downward trend, then you should purchase the contract and ride it out until the point when the current peak falls just below the previous peak point. At this stage, you should quit the market and watch out for another upward trend. The sideways trend in most cases acts as an interlude between the upward and the downward trends. It acts as a calm spot in the market when the shift is not as visible as in the previous two trends.

down trend


There are numerous trading strategies that a trader can use when in the forex market. For instance, swing trading, which is the easiest strategy, is done by catching the reactions within major forex trends. This is especially the case for the trends that tend to last more than a few days or weeks. The fact that there are clear stop levels as well as the fact that these trades often last for short durations of time, makes it much easier for the trader to undertake swing 
trades. 


Tuesday

Pipjet Review-Is It The Best Automated Forex Trading System?

If you have been trying to figure out which Forex trading system is going to be the best one to use, you have probably been overwhelmed with the number of different options that you have to choose from. There are literally hundreds of different Forex robots floating around on the internet and they all claim to be the best Forex trading system available. While this is going to be purely based on a matter of opinion, there is one solution currently available that has real life data to back up its success. This Forex system is called Pipjet, and it was created by the same team that created Forex Megadroid, which is the #1 Forex trading robot of all time.

Pipjet Overview

The Pipjet Forex trading system utilizes a Forex robot that executes successful trades by utilizing the USD/CAD trading pair. It also makes use of a more advanced version of the very successful trading algorithm that was used in the Forex Megadroid software. This technology is called the Reverse Correlated Time and Price Analysis system (RCTPA). The robot is able to determine which trades are the most profitable trades to make and then execute only those trades. This is where other Forex robots trading robots fall short. They are not able to analysis individual trades to see how profitable they will be. By using Pipjet, not only will you be able to decrease the amount of risk that comes with trading, but it will also result in more money in your pocket.

Another great advantage of the Pipjet system is that it makes trades by using the USD/CAD currency pair. There are many advantages to trading with this particular pair including:

  • It’s much more predictable than other currency pairs when it comes to price action accuracy 
  • · A majority of traders are unaware of the massive changes that have occurred with this trading pair 
  • · Allows Pipjet to use hidden automated strategies to generate large amounts of profit with minimal risk involved 
  • · Allows Pipjet to generate larger profits in a short amount of time


Also, by using the Pipjet robot, you will be able to take full advantage of the Asian trading session. One of thebiggest advantages to using the Asian session is that due to the decrease in spread, the Asian session is potentially one of the most profitable trading sessions to trade in. This is something that very few traders are aware of and Pipjet takes full advantage of this resource.

?Is Pipjet Easy to Use

The Pipjet software is very easy to download and install on your computer. It comes with plenty of instructions and technical support resources should you have any questions. This system is truly a set it and forget it system. Once you input the required data to get it started, it will make all of the necessary adjustments from on its own. The program also has a built in safety feature which will allow the Pipjet development team to prevent it from making any trades during unsafe market conditions. 

This is a great feature to have especially for those who are not very experienced with Forex trading. You also have the ability to disable this feature if you are a more experienced trader and want complete control over your trades.

?Pipjet Right For You

Pipjet has proven to be one of the more profitable Forex robots available today. The Forex Megadroid team has made public 5 real money live accounts so that traders who are interested in the Pipjet software can see just how profitable it really is. If you are looking for a Forex trading system that has proven to be effective and is backed by one of the most successful Forex software development teams today, then the Pipjet Forex robot is going to be right Forex trading system for you.


One of the real money accounts      


?Where Can You Find Pipjet

 You can get instant access to the Pipjet system by simply clicking on this link: GET PIPJET


USD/JPY

Fundamental: Last week, the US Fed finally announced that the new round of quantitative easing would occur and put a downward pressure on the US Dollar. The USD will continue to face downward pressure for the next few weeks, as the US prints more and more money. However, Japan made its own announcement recently and they will counter the appreciating effect QE3 has on the Yen. Therefore, the USD/JPY pair had a brief free fall and has appreciated since then.

The main downward pressure on the Yen comes from political tensions between China and Japan. Traders sold the Yen aggressively on Monday as concerns grew about the conflict having any economic consequences. Most of the money that got out from the Yen went into the Euro.

The Bank of Japan may expand its monetary easing so traders might continue to take their money to the Euro or the US Dollar. This is being highly speculated among the trader community as the Bank of Japan is likely to follow in the footsteps of the Fed and ECB. The BoJ Governor Masaaki Shirakawa said that a high priced Yen was creating problems for Japanese exports, so traders can expect some measures soon.


Technical: The chart shows us that the pair has largely moved sideways since the past month. The QE3 speculation and announcement caused a decline from the 7th of September, but the pair has largely risen from the 14th. This is due to speculation of Bank of Japan’s monetary easing as well as political tensions with China.

However, the price is currently at a minor resistance level, and if it needs to appreciate it will have to break through this one as well as one more at 79. A rally is likely after these levels, until the price reaches at 80, where the resistance is significant. Given that the pair usually moves sideways, it is unlikely that the price would break through this level. On the other hand, if the pair is not able to break the resistance levels, it might fall and reach two significant support levels at 77.996 and 77.380, which would require a major event to break.

MACD is currently producing a bearish signal, but is in a broader bullish mode. It has been rising since 12th of September and is at 0.153 right now. Stochastics are producing a bearish signal as well, but once it reaches the oversold mark, it should probably rise back again. Since the past week, it tends to remain in the overbought mark for long period of times, showing that the rallies are strong. 


USD/CHF

Fundamental: The biggest news this month was the Fed announcing a new round of quantitative easing. This has put a downward pressure on the US Dollar, which is expected to depreciate for the next few weeks. The main question for traders is whether the CHF will appreciate or depreciate, which will decide the fate for the pair.

On Tuesday US will release its CPI Inflation numbers, which traders should look out for. Apart from that, they need to focus on technical analysis by watching overbought and oversold levels, and continue to ride the QE3 wave.


As shown in the chart above, the USD/CHF pair was slowly descending in a downward channel from August. This was broken on the 7th when QE3 became a reality for traders, and the US Dollar was aggressively sold. Since then the pair has following a downward trend and has recently travelled sideways. This is because the USD became oversold and experienced a brief rally, which should not continue for long. The price has retraced back to its EMA, and should fall again soon.

If the pair experiences a strong rally, it will meet an even stronger resistance level at 0.945, which has been historically important. From the 7th to the 10th, prices stalled on the same resistance level (support level at that time), before breaking it due to QE3. Therefore, traders should not expect the price to cross this level until a major event occurs. The pair has no support level – other than the price’s own current position – so if the pair falls again it is likely that this will be a strong directional move.

MACD has been in the negative from the 5th of September, so there is a strong bias of shorting the pair. However, recently it has been bullish and has been rising from the 14th. Traders should keep in mind it is still below the 0 point, so a rally may not be as strong as imagined.

Stochastics just reached the overbought mark and is poised to descend. This is more in line with QE3 and should be bearish for the next day or more. However, traders must be cautious as it has just reached the overbought mark and hasn’t begun a descend, so they should wait until a clear sign emerges. 


Monday

GBP/USD

Fundamental: On Thursday Ben Bernanke announced that the third round of Quantitative Easing would begin, causing the dollar to free fall for a short amount of time. Since investors were already expecting this move, USD had been falling throughout the month. Nevertheless, QE3 will put a downward pressure on USD and should cause GBP/USD to appreciate, all else being constant.

On Tuesday the US will its CPI Inflation data, which will be crucial for the pair. This is usually used for the Bank of England’s inflation target. Previous CPI data was 2.6% versus a forecast of 2.3%, and this month analysts are expecting the percentage to be at 2.5%.

Therefore, traders should look out for the news on Tuesday and then initiate a position. QE3 is likely to appreciate the pair throughout the week, but right now the conditions are overbought. This should resolve soon and the rally is likely to continue.

Technical:


The chart for GBP/USD is much similar to EUR/USD. Before September the pair was mildly rising in an upward channel, but adopted a new angle on the 4th of September and has been rising in the new channel ever since. The price did not have to face significant resistance levels until now, where there is resistance at 1.6296. The price is very close to this mark, so traders should wait and see if there shall be a breakout or a reversal. In case the resistance level is breached, traders should expect a decent rally which is supported by QE3. In case of a reversal, the price is likely to reach back to the support level at 1.616. From a long term perspective, any reversal would be brief and appreciation is more likely.

MACD has been above the 0 mark since the start of August. Recently, it gave a brief bullish signal but is giving a bearish one at the moment. Since MACD is being supported above the 0 mark, it is likely that its bullish signals will be much stronger than the bearish ones.

Stochastics have been bearish the whole day. They’re reaching the oversold mark soon, but according to historical analysis they should remain here very long. Traders should wait for a bullish signal before initiating a trade, as the news on Tuesday is very important.


EUR/USD

Fundamental: The most important news for the foreign exchange market came before the weekend, when Ben Bernanke officially announced a new round of quantitative easing. The US Dollar fell till the weekend, and has recently begun a rally. QE3 is going to push the USD downwards during the new few months, so the direction of pairs will mostly depend on whether other currencies are depreciating as well or going in the other direction.

The Euro had been appreciating from the past few days as the ECB gave its complete backing to the currency. However, a fall was expected today but did not happen as political tensions between China and Japan caused money to go out from the Yen and into the Euro. Traders should look out for news on Tuesday when the German ZEW Economic Sentiment is released, and on Thursday when we find out about Spanish bond auction, German PPI, Flash PMIs and Consumer Confidence.

Technical:


A regression channel shows that the EUR/USD pair was rising from the past month, and broke out on the 5th of September. Since then it largely followed this angle and broke some resistance levels. However, it has been horizontal from the past 3 days, and fundamental news this week will decide its direction. The closest resistance level is at 1.328, and if the price breaks through this level, we could expect the currency to rally for some time. If the pair falls from its trend line, then the closest support level can be found at 1.300. If the Euro breaks through the support level, then we can expect a fall till the next resistance levels or regression channel lines at 1.275 and 1.269.

If we examine the MACD, we can see that it has been above the 0 mark the whole month, even when it is bearish. Since the 14th of September it has produced a bearish signal, and the price is horizontal. Therefore, we would have to wait for economic news or watch for a break out to take a position.

Stochastics are also bearish, but they have reached the oversold mark. Traders should wait for a bullish signal before executing a trade, as they can remain oversold for a long time.


Trade Like A Sniper The Way to Success

In forex trading, being a sniper is usually more preferred when compared to other types of strategies like machine gunners and the kind. Maybe I should start by helping you understand exactly what I mean by being a sniper. 

The use of this analogy stems from the word sniper in the military. A sniper is often hidden in the bushes, typically far away. The sniper is rarely seen in operation; however, the effects of his or her work are often devastating and of very large magnitudes. The idea is simple, instead of being bullish; the sniper gets the work done without the pomp and colour that most people would enjoy. The sniper would typically set up without problems and without hurry and wait for his target to be perfectly set before the shot is taken. Once the target is well in the scope, the shot is taken and the target is fallen. The end result is the use of minimal effort to achieve a certain goal.

When this analogy is juxtaposed to the forex market, the similarities are abounding. For instance, it is very true that people who take their time to analyze an option before making the trade often end up with much better deals than those who trade in a rush. The time taken allows the person to study the trends and determine the best time to invest. Like the sniper, this strategy relies on the ability of the individual to prepare for the trade.

Like the sniper, in forex trade you need to have an edge, or a weapon that you have mastered and one that you are comfortable using. What comes with such weapons is extreme self-discipline in order to avoid the temptations that may come your way in the name of quick and easy money. This is especially important for people who intend to have long term success in the forex market.  

For you to operate like a sniper in the forex market, there are a few things that you may need to know and implement. To start with, at times you will have to accept that a little less is actually much better than more. In forex trading, there is often the temptation to trade more of a certain option especially when the going is good. In truth, there are certain levels beyond which a trade does not make economic sense. You will also need to develop patience as a skill. This allows you the time to choose the correct options and maximise your profits while ensuring long time success. You will also need to allocate yourself higher timelines to allow yourself the options of recouping losses and going back on mistakes before heavy losses are incurred. In general, trading higher timelines often increases the probability of trading success. As such, snipers in forex market should have the ability to be patient and invest more in the higher timelines. One of the other tools that you will really need is the mastery of whatever strategy you come up with. Once you develop a strategy, it is important to ensure that you have it at your fingertips in a way that there are no shock moves that may affect your trading. 


Thursday

Growing Your Forex Trading Account


Growing your trading account from a small account to a large account in the forex market is harrowing task. However, with the proper practices, this process, though slow, can be very fulfilling in the long run. In this article we seek to look at some of the things that you ought to put in mind if you are to grow your trading account in the forex market.

The first rule and one of the most important things to put in mind is that while the goal of the forex market is to make money, it is important that while growing your trading account, you should maintain you focus on trading the market and not making the money. Even as I write it down, I recognize the difficulty in separating the two. However, this should be the starting point of anyone intent on growing their trading accounts. The logic behind this thinking is a little complex. Often, people coming into the forexmarket are intent on making quick money and achieving financial stability in the shortest time possible. As such, most of them usually attract and implement strategies that often only lead to short term success. In the long run, their growth curves flatten and even dip before they peak appropriately. Therefore, it is important that you develop the skill and master the art of trading small accounts, before you upgrade to the much larger accounts. This is why I started of this discussion by pointing out that to grow your trading account; you need to focus on trading the market instead of making money. Once you have mastered the skill of trading the market, then you can begin making the money in the forex market.
Secondly, you need to look at your small account as if it were a big trading account. Thinking in large sums makes you envision what strategies you would employ if that were actually the case. In essence, you will begin preparing yourself for the larger trading account before the reality sets in. Such thinking allows you to open up and use the macro strategies on your current trading account. When you start piecemeal implementation of the macro strategies, then you gain experience slowly as you grow. You also develop a perfect strategy for yourself through trial and error and along the way, master your skill in trading the market. At times, small account traders lose money simply because they did not envision the larger platform on which they aim to operate at some point.

Consistency - A consistent track record is something that can only work in your favor. Such a record can only be created through the consistent implementation of proper strategies. The primary goal of your small trading account should be to make every trade successful. The larger the number of successful trades you make the better it will be for you in the long run. It is said in the Bible, if you manage smaller things in a good way, then God shall give you much bigger things to handle. The same analogy can be used in the case of forex trading. People who exhibit skill in the management of smaller trades often go on to have larger successful trading accounts that remain successful for a long time.


Monday

How To Handle Indecision At The Forex Market


Do you have a problem pulling the trigger in the forex market? Do you know where the problem arises? How can you sort the problem of being gun shy in the forex market? These are only some of the questions that are normally asked with regard to pulling the trigger on trades. Most often, a trader sees an opportunity presenting itself. They look at the opportunity and it is one to die for; however, they hesitate and watch the opportunity roll away. What follows is that the trade becomes successful but the trader has missed his or her opportunity. The next time such an opportunity arises, they rush into it, but the result is disastrous. This is just one of the many reasons that traders in the forex market fail to pull the trigger when required. Often, the diagnosis to this problem reveals that such a person lacks the confidence a trader in the forex market requires. Often, such a person may have attended seminars and read on the topic but has not tested himself or herself on the market itself. Such a person may also be facing a split conscience where they are not entirely certain of their trading strategy. In addition, a person may suffer from gun shyness owing to an excessive amount of pressure that may have been placed on one trade. This is especially the case for people who tend to invest large amounts of money. 

Whatever you reason for being gun shy in the forex market, it is important that you have some fail safe mechanisms, which will help you in such situations. The first thing that such a person ought to do is learn to grow his or her confidence. There are various ways of growing in confidence when on the forex market. You can engage in paper trading, which not only helps you practice your strategies, but also gives you the confidence and the skill to apply in real trades. These demo accounts are often important, especially for newbies since they develop the person’s abilities in situations similar to the real market trades. Often, traders are advised not to fret over losses made on the market and believe in their ability to play the market with cutting edge success. 

Facing your fears is a strategy that often works when used effectively. Most often, gun shyness arises from an internal fear that sows seeds of doubt in the person. However, once you understand and face your fears, then your ability to perform is normally increased by a very large percentage. Learning to handle the high adrenaline situations in the forex market helps you develop as a trader and allows you to think clearly even in these highly charged situations. As such, putting yourself in these high risk situations often can help you overcome the fear of pulling the trigger during trades. What works for you is the important question. Whatever the situation, first begin by analyzing the reason for your gun shyness and then prescribe a solution and execute it. 


Wednesday

How to Trade the Pin Bar – MACD Strategy

The pin bar – MACD strategy involves using candlesticks (or OHLC bars) and the MACD indicator to form a simple trading method. This system is best used in 4-hour charts – and if used correctly – should provide simple profits.


But before we go through the strategy, learning how candlesticks work is essential. Candlesticks contain data on open, high, low, and close values for each period. The thin lines on the top and bottom represent high/lows of a particular time period. The high is called the upper shadow, while the low is called the lower shadow. If a forex pair closes higher than the opening price, then a hollow candlestick is formed while a black one is formed if the close is lower than the opening price.

A pin bar is a candlestick whose upper shadow or lower shadow is far longer than the other one, and is often accompanied by a small real body. A bullish pin bar contains a long lower shadow, a small body and a small upper shadow, whereas a bearish pin bar contains a long upper shadow, a small body and a small lower shadow. A bearish pin bar is shown in the picture below.


Shadows – or wicks, as they are called – represent buying and selling pressure. A long upper wick would show that the bulls tried hard but the bears overcame in the end – thus, the bears won and the sentiment is likely to continue in the near future.

Once the concept of the pin bar is understood, the strategy should become easy for a trader. His trading should be in a 4 hour timeframe with only MACD as a technical indicator (default settings of 12,26,9 are recommended). This strategy works with all currencies – it’s that simple!

Once the trading setup is understood it’s time to go over the rules. These are as follows:

1.The 4 hour MACD should be below 0 (and likely to be bearish).

2.A bearish pin bar is spotted on the graph.

3.Set your stop loss 1 pip above the highest point of the pin bar,just so you don't wipe out your account.

4.Your trading objective should be to have a 1:2 risk-reward or even better. 

The rules for buy trades are the same, except the 4H MACD should be above 0, and the stop loss should be 1 pip below the lowest point of the wick.


The chart above shows two short entries, as pin bars were seen and MACD was below 0. The trade ended with a 116 pips profit, while the second ended at break even.


Monday

USD/JPY Technical Analysis

On Friday all eyes were on Bernanke as it was thought that he would lay some ground for the FOMC meeting and decision on 13th September.Although it was said that action was necessary to facilitate the labour markets,traders were still unsure whether QE3 was coming or not.This week we won’t see quantitative easing affecting our charts.

The Japanese Yen has been strengthening and has recently caught the eyes of the Bank of Japan and Ministry of Finance.Meanwhile,the US Dollar has been declining itself again.The price action and low volatility still haven’t made a case for intervention,but Bank of Japan may intervene at some point.They are known for stealth tactics.


Examining the 2 hour frame chart above,we can see that the pair been moving sideways since the past month.However,the past 10 days saw a significant sell-off,after which the price has been edging lower.Currently,the pair is hovering between the support level of 78 and the resistance level of 78.7,and it is most likely that the price should stay here for most of the time. However,in case it breaks the support level,a short trade could be initiated,whereas a long trade could be executed in case the resistance level breaks.


MACD has been moving down and sideways throughout the past week,but has stayed below 0. This shows that there is a bearish atmosphere as the price continues to move within the support and resistance levels.However,currently MACD is edging upwards,which may indicate signs of a weak rally – since it is still below 0.

Stochastics have been moving upwards lately and should reach the overbought level if the pace continues.They are likely to oscillate less than 10 times throughout the week,so they should be taken in consideration with other signs.

Since the pair is trading sideways,one could look for signs of price oscillations.If these oscillations become long enough,one could initiate long and short trades along the waves.


USD/CHF Technical Analysis

Fundamental: The price of USD is still uncertain as Ben Bernanke’s announcement on the 31st did little to confirm QE3.Therefore,this week won’t be affected by these measures. Nevertheless,USD is moving downwards since the past month,but may stay towards the upper side of the bearish channel.

Technical:


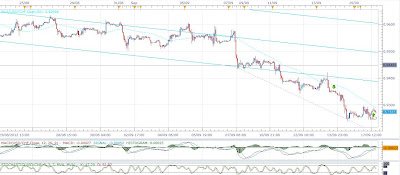
The 2H chart shows the current bearish channel USD/CHF is in. A regression analysis since the 25th of July shows that the price tends to oscillate in the boundaries,but since the past 10 days it has remained in the lower end of the channel.If the price breaks out from the resistance line at 0.9667,then a long position would be applicable.However,it is most likely that the pair would continue to plummet.Therefore,the support line at 0.9448 should be seen as a breakout could see a steady fall of the pair. 

MACD is bearish as it is below 0,but is moving sideways.This shows some uncertainty in the market,but the bias is towards the negative side.Stochastics have fallen from the overbought level,and are currently moving upwards again.However,the price is still largely stagnant so support and resistance levels may be better indications.


The USD/CHF bearish pattern is occurring due to the fall of USD,as seen in the chart below:


USD seems to be moving sideways since the past few weeks,but it is in a larger bearish pattern.An introduction of QE3 could make it plunge,along with the USD/CHF pair.

MACD on the USD is bearish and below 0,signalling a decline.Stochastics have just reached the overbought level and are coming down again.Therefore,both signals are bearish for USD. However,if they break out from the upper channel at 10,033,then a long trade for USD/CHF would be favourable.


GBP/USD Technical Analysis

Fundamental: Those who were tuned in for Ben Bernanke’s Jackson Hole speech would be left disappointed as the Fed did not commit to QE3. There is uncertainty in the market whether quantitative easing will occur or not,nevertheless,it should not affect this week’s outlook.


USD has been declining since the past month,however,it is likely to remain on the upper side of the bearish channel it is currently in. A breakout from the upper channel line at 10,040 would signal a bullish rally, which could be bearish for GBP/USD, provided GBP does not rally as well.

Trade numbers for UK have been disappointing,with a £10 billion short-fall on the goods/services balance.Exports to Europe are weakening as the UK tries to find other markets.The country’s central bank will be expanding its QE program to £425 billion,up from £375 billion. 

The UK PMI for August is 49.5, which is better than expected. Consumer goods producers have also seen their outputs increased, so GBP has been appreciating. This is a good sign for the economy, but the outlook is still poor as demand and investment spending are weak.


Looking at the 2H chart,we can see the GBP has been edging upwards lately.The 2 month regression channel shows that GBP/USD has been bullish,even though it is highly oscillating. From the 21st of August,it has stayed in the upward level of the channel, where a lot of support and resistance lines exist.If the price breaks through from the 1.59 resistance level, a long trade may be favourable.On the other hand,if the price breaks the support level of 1.5812,it could move in the lower level of the channel,and even hit the lower end.Given the current circumstances,a bullish rally is more likely. 


Stochastics are currently moving sideways. Even though they are currently in a bullish mode, the signal is quite uncertain. MACD is still pointing higher, but its trend is not as strong as before. 

Therefore, support and resistance lines should be given the most importance. Any breakthroughs can trigger long or short trades.

Sunday

EUR/USD Technical Analysis

Fundamental: The most important news for the pair was Ben Bernanke’s speech at Jackson Hole on the 31st. The central bank still hasn’t clearly announced that the next round of Quantitative Easing will occur, and the conference suggested that it will stay on the side lines for the time being. QE depreciates the USD and appreciates the pairs, so a serious decline in the dollar is still away.


The chart above shows the USD with regression channels. The price is moving in a downward channel so far. Any confirmations of QE3 will pressurize the price to plummet further.

An important event to look out for is the announcement by European Central Bank president Mario Draghi, as he plans to introduce measures which should address the problems of Spain and Italy. These measures are likely to include buying bonds of the two nations to reduce their borrowing costs. EUR is currently strong in anticipation of these measures,however,if they are found to be ineffective the pair could plummet once again.

Technical:


Examining the H2 timeframe, EUR/USD has been rising weakly since the past week. A 10 day regression analysis shows that the pair is making gains and is currently staying on the above line of the channel. This is reflected by the current market view that ECB will introduce effective measures, and that the Fed may introduce QE3. 


Stochastics are currently bullish and edging towards 80, signalling that there may be some gains made in the coming day. MACD, however, is moving sideways – and even though it is currently bullish – it signals uncertainty in the market. 

EUR/USD is best traded on market news these days, as any sign of good or bad news shifts the price significantly. The bullish rally could easily be reversed due to the ECB; it is well known that the European Central Bank is quite divided and has yet not reached to a permanent solution.

On a closer view of the chart, the pair seems to be showing bearish signs. Friday’s close ended with a shooting star candle, and if the price breaks through the support line of 1.2425, a sell-off rally may occur. On the other hand, if the price exceeds the resistance lines of 1.2692 and 1.27, then long trades would be more favourable. However, a bearish mood exists for this week so any signals for shorting should be picked up.