Sunday

EUR/GBP Weekly Outlook

The EUR/GBP started the week with markets pinning high hopes on the European Central Bank initiating fresh stimulus measures to provide a comprehensive solution to the region’s debt crisis. But after the disappointment on Thursday, when the ECB offered no guidance or assistance in its monthly meeting and statement, traders became restless and hammered the euro below the 0.785 mark against the pound sterling. Mario Draghi said the ECB was likely to undertaking open market operations, such as buying bonds in the secondary markets, but failed to explicitly layout any plans to buy government debt from struggling European countries any time soon.

The GBP also faced a week of disappointing economic data with trade deficit hitting an all time high in June on Thursday. Data from the Office for National Statistics showed, deficit widened more than expected to 10.1 billion pounds ($15.82 billion) in June from 8.4 billion pounds in May, as weak demand for goods hampered exports. Earlier in the week, Industrial Production slumped to its lowest level in 20 years in June, and the Bank of England slashed its growth forecast for the year. 


The counter-trend rally in the EUR/GBP from 0.7755 is possibly finished at 0.7962, the intersection of a falling trend line and the swing bottom created on May 16, both of which have been tested quite a few times. EUR/GBP is all set to resume the broad down-trend, and in the coming week, prices are expected to find support at 0.7755, the break of which can see prices go to the next key support level of 0.7693. On the upside, 0.7900 is a strong resistance, and any upside break-out will turn the bias neutral.


Thursday

Low Frequency vs. High Frequency Forex Trading


Forex (currency market) is the largest financial market in the world, currently trading $4 trillion daily. These trades happen 24 hours a day, 5 days a week; making it one the most attractive markets for traders. This has led to two types of traders: lower frequency traders with a long-term perspective, and high frequency trader who have an intra-day perspective.

Low Frequency Trading

Low frequency trading involves a trader or an investor taking a long-term perspective in a forex pair(s) and holding that decision for a long period of time. This time period lasts for months, a year, or even more. This strategy is usually taken by professional investors such as hedge fund managers or those who do not have time to be monitoring trades –such as the average John Doe.
Basic strategies used for low frequency trading involves the use of technical analysis with long period charts, such as those which show months and years. Carry trades are one of the most famous strategies; these involve using a pair which provides the most interest rate to the investor. Macroeconomic perspectives and geopolitical forces are also used for low frequency trading.

High Frequency Trading

Intra-day trading is the more famous of the two in the forex market. Traders usually use charts ranging from a tick, 1, 5 and 15 minute ranges. Scalping is common, involving frequent trades which take a profit of a pip or less. Others follow small trends, oscillations, or trade on daily market news. While these profits are minute, traders use leverage ranging from 1:2 to 1:500 to amplify their gains and losses.

Which is better?

Statistics: this question largely depends on the strengths and weaknesses of the trader, but statistics show that high frequency traders make far less profits than low frequency ones.

 Market noise: the forex market involves trillions of dollars of trades every day, most of which are done by large organisations conducting their business and not following market trends. This produces a lot of senseless noise which cannot be understood by traders. When one takes a long-term perspective, market noise is reduced and strategies (especially those involving technical analysis) become more robust.

FreeDigitalPhotos.net

Stress: if you are a trader who does not want a lot of stress, low frequency trading is for you. Those who watch markets all day can watch their trades suffer heavy losses and experience high profits, and become concerned by it.

 Gambling effect: there is a large consensus that trading can become as addictive and destructive as gambling, and this is largely true for high frequency trading. You can watch your trades double or triple in size within seconds or minutes, and soon you will try to get those gains again and again.

Spreads: this is perhaps the most important reason why one should prefer quality trades over quantity trades. Whenever you execute a trade, your broker takes a spread (usually between 0.5 to 2 pips for major pairs). High frequency traders are usually chasing a few pips, so every time they close a trade they give up a significant part of their profits. This also results in losses as many trades become impossible to execute. If you are trading long term and aiming for 100-200 pips, 2 pips would hardly be 1% of your profit.

However, this is largely up to you and your abilities as a trader. But considering the pros and cons of each, it is best if low frequency trading is done.

USD/JPY Technical Analysis


In the 4 hour timeframe, we have seen a resistance level of 78 which, if broken, will give a sell signal. This may allow the price to go as low as 77.66 experienced earlier on the 1st of June, and 77.50 in extension. Therefore, the bearish channel is reinforced and a bearish outlook shall remain until a breakout of 78.80 is experienced.


The hourly timeframe shows that a narrower bearish channel has already been broken. Earlier, a false breakout was experienced followed by a successful one, which seems to be continuing at the moment. This is being resisted at 78.15. It is important to notice that we could see a triple bottom soon; there have been two bottoms experienced already.  
If this is experienced and a breakout on the upper resistant levels is experienced, we could see a significant reversal.


Stochastics for the 4 hour chart are in a downward trend, currently hovering at 50.75. MACD seems to be bullish but is giving a lot of false signals and is roughly horizontal.
This shows resistance and a slowdown of volatility for the pair. RSI seems to be roughly horizontal as well.


In the hourly view, MACD is in a bearish mode, although this has been continuing for a few hours and might come to a halt by the end of its wave. Stochastics already give a signal towards a reversal, and so does RSI, which means that the MACD might show a bullish signal soon, and that the oscillations currently occurring in the price might continue.

Fundamental: Tonight there will be an announcement from the Bank of Japan regarding interest rates. Although some economists do not expect an extension of the acquisition programme until the next interest-rate meeting, there is a good chance that it might happen at this meeting. This will affect JPY trading for the next day.

There is a strong chance that the USD/JPY pair will strengthen due to the turmoil experienced in Japan’s political environment. The current government may face a No Confidence vote. The opposition party, which may take control, advocates a higher inflation rate target of 2.0%, which increases the expectations of an aggressive Bank of Japan easing. 


Wednesday

S&P 500 Technical Analysis

The 4-hour view of the S&P 500 shows a bullish equidistant channel starting from roughly May 20. It may be possible that the price hits the resistance levels of 1413 and 1424, but a reversal to the lower end of the channel is also possible. A bullish sentiment is likelier as one can notice that the bullish rallies are oscillating higher and higher while the bearish ones are getting smaller.


In the S&P500 daily chart, we can notice the bullish sentiment by the technical indicators. Stochastics have crossed the 80 line and are going higher after giving a bullish buy signal. MACD has been bullish since early June and continues to go higher. Its sell signals are usually weak and false while the buy signals are proving to be correct. The Relative Strength Index has been going higher and has yet to cross the 70 mark. Look out for an overbought signal in a few days if the rally continues.


If the price channels are taken into consideration, the price has largely been following a trend as it has tuck to the upper price channel since the start of August, coming down to its mid-point a few times, and going back up. It has not touched the lower price channel once since the start of July.


The weekly chart confirms the rally; the index has been rising from May and continues to do so. If the index reaches the upper price channel at 1422, a reversal to the mid-point (1344) or lower end (1266) of the price channel may be seen. MACD recently gave a buy signal and is expected to be bullish for a few weeks. Stochastic has been bullish but is crossing the overbought mark at 80; contrarian traders should look out for a bearish signal in the coming weeks. RSI has been following the price trend and may give an overbought signal in the coming week if the trend is to continue.

Fundamental: Market sentiment has become worrisome as the rally continues as strategists suggest that the rally is unlikely to last and investors should remain cautious. A negative close by the end of the week may be likely, which corresponds with a bearish reversal towards to the lower end of the channel as seen in the technical analysis chart.

The job report on Friday, which caused the rally, is thought to be misplaced as a large number of jobs are only temporary. The hiring boost that occurred may be largely due to seasonal employment. GDP growth has been 1.5% in the second quarter, which is considered largely anemic.


GOLD Technical Analysis


Gold has largely been falling since its peak in March, and since mid-May it is hovering between a horizontal price channel. Since the start of August, it started ascending from the midpoint and is currently rallying at 1615. A rally till the upper level of the channel at 1631 is possible. MACD has been bullish since the past few weeks, but its lines are coming closer to converge, suggesting that a sell signal may be produced soon. Stochastic produced a buy signal at the start of August, but this was produced at 62, which makes it relatively undesirable. RSI is giving 
similar signals. 


In the weekly chart one can notice the upwards trend experienced till mid 2011, and a fluctuating reversal ever since. RSI has been hovering near 50, not producing any particular trend, which means some resistance at the current level is likely. Stochastic has been in a bullish mode since May, although the small rally currently experienced started only recently. MACD seems to be giving a buy signal and a sign of reversal, but this could easily be a false signal and should be treated with caution. 


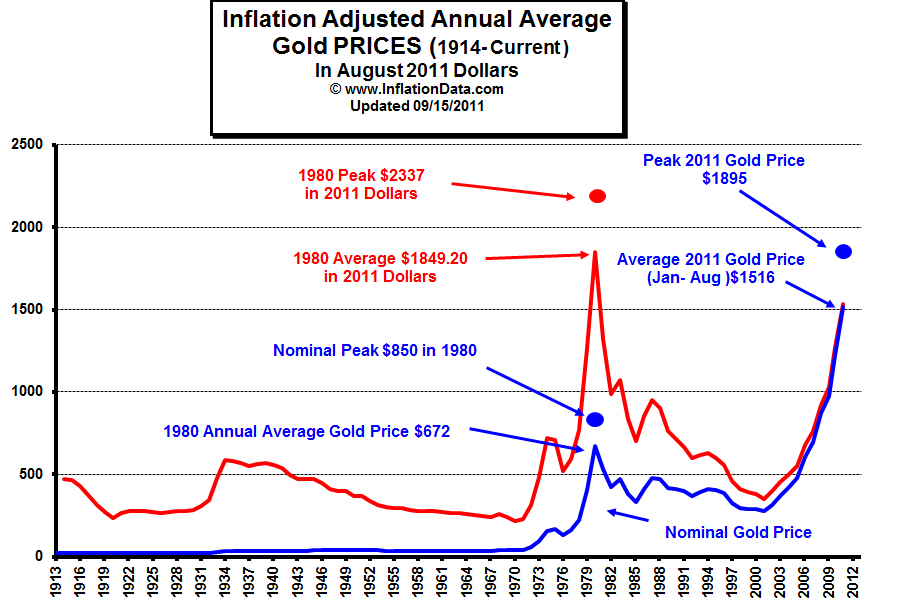
Gold has to be taken very cautiously due to its recent year-long decline. When its price is observed on a century long inflation-adjusted chart, one can see its crash in the 1980s, which could also be experienced in the coming years. Buy and hold investors may not like gold as a stable investment for now.

Fundamental: ECB and Fed did not provide any new stimulus programmes, but the price of gold has still maintained above $1600 an ounce. It seems one minute the ECB is prepared to do whatever it takes to save the euro, and the next it fails to take any action.

In the US, the Fed has admitted that economic growth has slowed down. Disappointing news also came from China, where manufacturing dropped to 50.1 in July (PMI). In the UK, the PMI dropped more than expected from 48.4 to 45.4. If these problems are worsened, it is logical to keep one’s money invested in precious metals. However, if market sentiment is positive, one must be cautious towards gold.


EUR/USD Technical Analysis


The euro dollar pair is following the equidistant chart pattern in the 4-hour view. The trend line has hit the channel 4 times so far, indicating that the pattern is strong, which is also supported by the 3 month long duration. Recently, the line hit the channel at 1.244 and proceeded to fall as expected, albeit meeting some resistance. More resistance is likely to be met at 1.225, and if that is broken, the trend line is expected to fall and meet the next resistance at 1.2159.  However, considering a long term view (of 30-60 days), the pair is expected the meet the 
end of the channel.


In the hourly view, the trend line hit the high resistance level at 1.244, lowered to 1.236 and is meeting another resistance level over there. However, the 4-hour view would suggest that it is likely that the pair would break resistance and follow the downward trend.

MACD shows that the trend is downward, however, it does not seem as strong as the bullish signals it gave earlier on the 3rd of August. Contrarian indicator Stochastics shows a downward trend as well and currently hovers at 31.50. A bullish or bearish signal is not visible and should only be treated seriously once the 20 or 80 lines are crossed. The Relative Strength Index roughly corresponds with Stochastics as it hovers near the same 30 level. All 3 indicators agree with a downward pattern.

However, it must be noted that this isn’t strong and is meeting with a lot of resistance. The 10 day EMA corresponds with the current price level so a strong downward and upward trend cannot be predicted. Indicators may produce fall signals until resistance points are broken strongly.

This can also be seen by using the same indicators in the 4-hour chart. While the MACD is bearish, it is still following an ascending pattern. The Stochastics are giving a bullish signal as well. This may result in the pair hovering at the upper levels of the channel for some time, but it is unlikely that the channel will be broken. By examining the last time when the pair hit the upper channel, it seems that the trend line seems to hover on the upper levels between 5 and 25 days.

Fundamental: Most industrial production data of the eurozone showed a decline. While the sentiment of the FX market is generally positive, there is some strong resistance and risk appetite has been on hold until the ECB or Fed introduces some measures. If not, a correction may be likely.

Forex Over Trading


Over-trading is a common mistake by Forex traders and it can be the biggest threat that can kill your trading account. It does not require experience as market participants. Once you commit mistakes, it makes huge impact and differences. What causes bad trades? These can include indecent opportunities, negative environment, being impatient and lack of discipline. Forexover trading mostly happens with those traders without proper plans and lack the determination to set their minds on their plans.

Forex over trading also happens when traders break the rules. Basically, you do over-trading when you get more trades than you suppose to have. Some traders tend to break the rules because of the pressure to earn more money. Money is the root of all evil. You can do unnecessary things to have it. Forex over trading can mislead the cycle in the market. Traders are not able to see their profits if they have consistent over trading. This is the reason why Forex over trading sometimes happen without the trader actually knowing it.


If you do trading daily at lower time frame, you are Forexover trading.  Doing it is not appropriate before you know how to earn income daily. Trading in lower time frame is done by traders who process more information while margins of error are little. Providing a lot of information may mislead the cycle in the Forex market.

The best way to avoid Forex over trading is to make the best plan and share this plan to others. It is like you are on war, you have that courage and a gun but unfortunately you don’t have bullets. Success will be on by planning. When time comes, you will find your balance decreasing. It is the best way compared to those traders who tend to break the rules. It’s like boxers who lose the fight when the best was not given.

Knowledge is also an important aspect in Forex. Having proper Forex education avoids Forex over trading. To avoid Forex over trading, you have to be contented. If you break the rules without knowing, you have to make it right as soon as possible before it becomes a habit. Habitual Forex over trading is a violence attitude that can kill your account. To keep on the right track, you have to follow certain rules. The rules to be considered are the following:

Make a well-developed plan.

Have some market analysis.

Be ready for your setups.

Make a trading journal. You have to track and record trades.


Forex over trading can lose your money. However, you don’t have to be afraid of losing. As traders, you must know why your money loses.  The reasons may be because you are over-trading, you don’t have proper knowledge and well-planned strategy and you are not contented with what you have. You will be
successful if you will follow the proper way. Successful and famous traders experienced failure. For them, trading is worth it when you know how to do it right.